Defining Statistics
Once the current year’s school library survey data are uploaded and ready, the new stats need to be defined.
- Database = lrsi_school
- Table = _2018
You can use LRS to create definitions for your new statistics. To see a list of all new (or, unrecognized) statistics, go to:
https://www.lrs.org/school/data/tools/discover-new-stats/?year=2018&first_submit=Submit. I
The easiest way to do it is to right click the link the “Create Statistic” link and open in a new window. It also helps to have the data open in a spreadsheet so that you can see the values and more easily set the “Format” setting.
You can view the current stats at https://www.lrs.org/school/data/tools/edit-statistic/ if you’d like to see examples.
Format
- number = integer
- number1 = number to 1 decimal place
- number2 = number to 2 decimal places
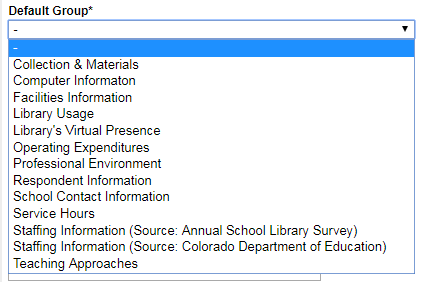
Default Group
Each statistic is assigned to one of the following groups for the display and selection of the data on the web.
Order
The order in which the statistic will appear within every group of which it is a member.
Total Group
We no longer use this group.
The Benchmarks page https://www.lrs.org/school/data/totals-and-benchmarks pulls data for groups (https://www.lrs.org/school/data/tools/edit-group/) that are type “ratio,” e.g. Weekly Services.